A pace plan is a claim: ride at this power and you reach each control at this time. Pacer makes that claim for every route you give it, so we wanted to see it hold up against a ride that really happened, and none is better for it than Paris-Brest-Paris. About 1,220 km, around 90 hours, two or three nights, and thousands of riders on the same roads.
Six riders who rode the whole of PBP 2023 shared their rides publicly, with power, second by second. We asked Pacer what it would have told each of them, and set it beside what they did.
We don't name them. These are their rides, not ours, and nothing below carries a time of day, a start wave, a finishing time or a weight that would tell you who they are.
The test
Pacer works out how long a stretch of road takes from the power you ride it at, your weight, your bike and position, and the road itself: its climbing, every 30 m, read from the ground. So the fair question is: give Pacer the watts a rider actually rode, and does it get their time right?
For each rider we:
- measured their weight with the bike, and how much air they pushed, from steady stretches of their own ride (Pacer's Fit from my rides measures the air from yours);
- split their ride at the controls into 106 legs in all;
- gave Pacer each leg's average power and asked how long the leg takes;
- added the legs up to an arrival time at each control, riding time only.
Every arrival, against the band
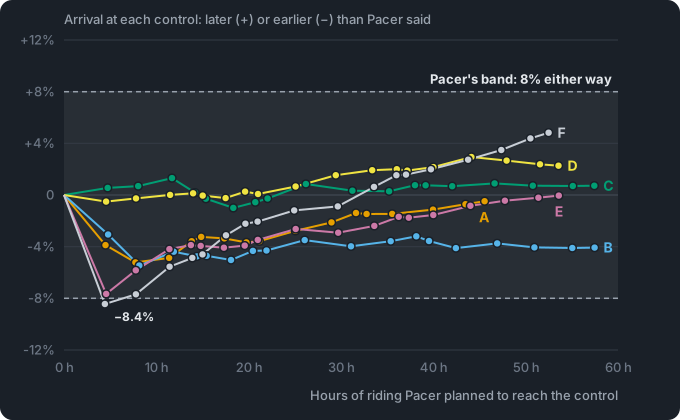
Pacer gives a riding time as a band, 8% either way, because wind and your position move a ride by about that much. Of the 106 arrivals, 105 fell inside it. The one outside missed by 8.4%. The median arrival was 2.2% off, and a leg missed by 4.1% on average.
Over the whole ride, the six riders finished between 4.1% faster and 4.8% slower than Pacer said, with the middle of them 0.3% off.
Agreement that close is partly two things cancelling. These riders spread their power more evenly than Pacer's plan does, and kept pedalling downhill where the plan freewheels, which costs time. And they rode much of the first day in groups, which saves it.
Two things show in the lines:
- The start is fast. Five of the six reached the early controls sooner than Pacer said, by up to 8%. The start waves leave in big groups, and a group saves a lot of air. Until Loudéac, about 20 hours in, riders went at 0.97 to 1.03 times the speed their power alone would give them on the flat and gentle rises.
- The second half is slower at the same power. After Loudéac it was 0.93 to 1.00 by day, and much the same at night. The groups thin out, and a tired rider loses speed in ways a power meter never sees.
The climbing has to be right
All of that holds only if Pacer reads the climbing right, and this check is how we found out it hadn't been.
Until late October, Pacer paced a saved route from the 201 points its profile keeps. On PBP that held 79% of the climbing the riders' own barometric altimeters measured, and these six riders were 3% slower than Pacer said.
Pacer now reads the ground under the whole route every 30 m. Read that finely and raw, the ground counts every small step as a climb, 24% too much. Smoothed the way the router smooths a profile, it comes to 99% of what the altimeters measured, with every leg between 92% and 107% of them. That is the profile every figure on this page was measured on.
Where a plan goes wrong: the watts
If Pacer gets the time right from the watts, the plan goes wrong when the watts do, and they do.
We held each rider at the power they averaged over the first two legs, as a plan made the night before would. Every rider was slower than that plan: by 2 to 8% already at Brest, and by 10 to 16% over the whole ride.
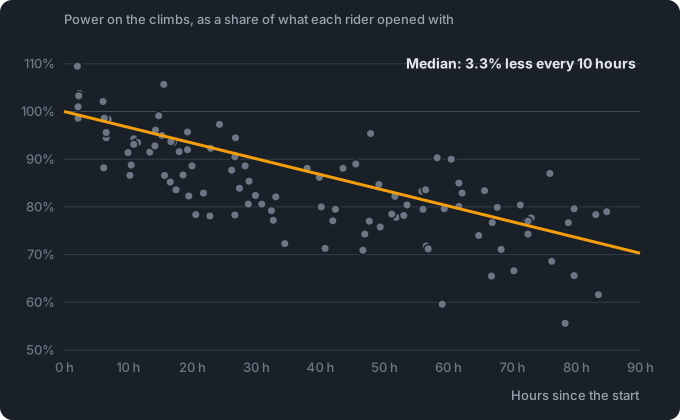
Every rider faded. Power on the climbs fell a median 3.3% for every 10 hours since the start, between 2.0% and 4.8% for each rider, and by the last third of the ride it was 67 to 83% of what they opened with. Their average power fell faster still, a median 4.1% every 10 hours.
A sleep did not bring it back. Measured from the last sleep instead of from the start, the fade disappears into noise. Riders woke up rested enough to go on, not to climb at their opening power.
Pacer's clock has a setting for this, Effort falls, as a percentage for every 10 hours of riding. Counted that way, these riders' effort fell about 6% every 10 hours, because a third of their time went on stops. Set to 7%, the clock put all six within 4% of their riding time, and the riders a median 2.7% slower than it said. That rate was measured on the same six rides, so it fits them better than it will fit you, but it is a far better place to start than none.
It starts at 0, because a fade is personal and only you know how you ride a third night. And it runs from the start through every sleep, because on these rides a sleep brought nothing back.
Night costs less than you'd think
On flat roads and gentle rises, the dark made little difference once the groups had thinned: between 3% slower and 2% faster than daylight at the same power, rider by rider.
Descents are another matter. After Loudéac, riders came down hills at 0.85 times the speed their power and the slope would give at night, against 0.92 by day. Tired, in the dark, on roads you don't know, you brake. Plan for it on a route that drops in the small hours.
Where the hours went
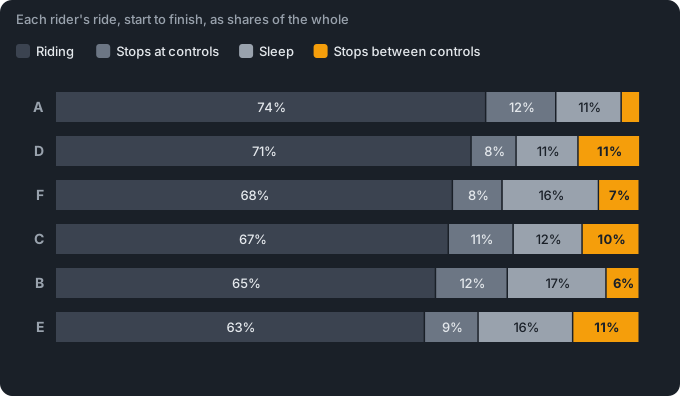
The riders were moving for 63 to 74% of their PBP. The rest went on:
- Controls: a median stop of 32 minutes, a mean of 38, and three in ten over 45. Pacer's clock stops 45 minutes at each control of a ride over 600 km until you say otherwise, which is about right.
- Sleep, here any stop of 90 minutes or more: 11 to 17% of the ride.
- Stops between controls: a café, a bench, a puncture, a nap in a bus shelter. 3 to 11% of the ride, and no control card shows it.
What it means for your PBP 2027
- Pace on the ground's climbing. Plan or import the route and open it in Pacer, which now reads the ground under all of it.
- Plan at the watts you will ride, not the ones you open with. Use By finish time to see what a time asks of you, then ask yourself if you can hold it on the third night.
- Set Effort falls. About 7% for every 10 hours of riding, and don't count on a sleep to bring the watts back.
- Spend the watts where they buy speed. Pacer's plan climbs hardest, eases on the flat and freewheels down anything steeper than 2%. These riders kept pedalling downhill, and at the same average power that is slower.
- Budget the stops. 45 minutes a control, your sleeps, and a few hours for everything between controls.
- Read the band. With the watts right, 105 of these 106 arrivals landed inside it. Plan your closing times on its slow end.
For what Pacer does, step by step: Pacer: what a ride will take, before you ride it.
Try it free at tourk.it
What this does not show
- Six riders. All six finished, and all six share their rides with power, which says something about how they prepare. Your PBP may look different.
- One year. One route, one week's weather, one field of riders.
- Measured on the same rides. Each rider's weight and aerodynamics came from their own ride. Measured on the way out only and used to predict the way back, the return legs missed by 5.7% on average, against 4.8% measured on the whole ride, and riders came home about 3% slower than their power said: the second-half slowdown above.
- Wind. Pacer doesn't model it yet. Weather reports from airports along the route explained part of each leg's miss, but no more than part.
How we worked it out. The ACP's 2023 route, with each control where the riders stopped. Six public ride files with power at one-second intervals from riders who rode the whole event; a seventh was left out because its power did not follow its speed on the flat. Pacer's physics with each rider's own weight and aerodynamics, a road bike's rolling resistance (0.005), asphalt throughout, at the average power each rider rode each leg. Riding time only, stops left out. Heights: IGN, RGE ALTI, Licence Ouverte 2.0, last updated 26 November 2024.
Paris-Brest-Paris is organised by the Audax Club Parisien, and TourKit has no connection with it.